Program started at Thu-08-Nov-2007 11:46. Analysed requests from Mon-01-Oct-2007 00:00 to Wed-31-Oct-2007 23:59 (31.00 days). (Go To: Top: General Summary: Monthly Report: Daily Summary: Hourly Summary: Organisation Report: Status Code Report: File Size Report: File Type Report: Directory Report) General SummaryThis report contains overall statistics. (Figures in parentheses refer to the 7-day period ending 31-Oct-2007 23:59).
Monthly ReportThis report lists the activity in each month.
Each unit ( month: reqs: %reqs: pages: %pages: Tbytes: %bytes: --------: --------: ------: -------: ------: ------: ------: Oct 2007: 22279825: 100%: 1128542: 100%: 46.30: 100%:Busiest month: Oct 2007 (1,128,542 requests for pages). Daily SummaryThis report lists the total activity for each day of the week, summed over all the weeks in the report.
Each unit ( day: reqs: %reqs: pages: %pages: Tbytes: %bytes: ---: -------: ------: ------: ------: ------: ------: Sun: 3461550: 15.54%: 132761: 11.76%: 6.62: 14.30%: Hourly SummaryThis report lists the total activity for each hour of the day, summed over all the days in the report.
Each unit ( hour: reqs: %reqs: pages: %pages: Tbytes: %bytes: ----: -------: ------: -----: ------: ------: ------: 0: 603536: 2.71%: 50516: 4.48%: 1.74: 3.76%: Organisation ReportThis report lists the organisations of the computers which requested files.
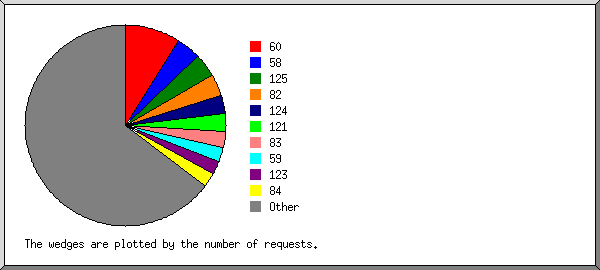
Listing the top 20 organisations by the number of requests, sorted by the number of requests. reqs: %bytes: organisation --------: ------: ------------ 2013016: 0.79%: 60 881667: 0.63%: 58 823336: 0.63%: 125 794388: 5.52%: 82 658283: 0.52%: 124 632123: 0.37%: 121 560752: 6.24%: 83 533306: 0.40%: 59 488547: 0.28%: 123 482739: 5.76%: 84 473682: 5.83%: 85 420030: 4.24%: 87 401981: 0.01%: 129.13 319715: 3.31%: 88 269536: 1.70%: 77 236909: 0.68%: 74 221188: 2.48%: 90 218731: 0.09%: 116 199167: 3.10%: 89 181996: 0.02%: 66.249 11468733: 57.42%: [not listed: 11,022 organisations] Status Code ReportThis report lists the HTTP status codes of all requests.
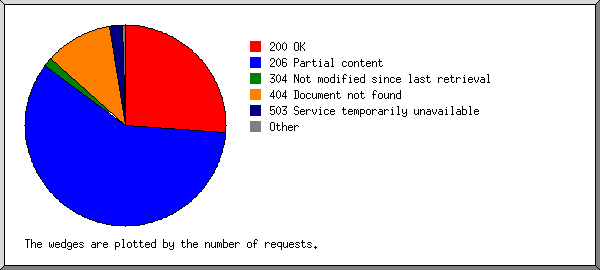
Listing status codes, sorted numerically. reqs: status code
--------: -----------
6720531: 200 OK
15192930: 206 Partial content
14399: 301 Document moved permanently
30688: 302 Document found elsewhere
366364: 304 Not modified since last retrieval
2615: 400 Bad request
9400: 403 Access forbidden
2804052: 404 Document not found
9263: 405 Method not allowed
8: 412 Precondition failed
25828: 416 Requested range not valid
9: 500 Internal server error
20: 501 Request type not supported
541647: 503 Service temporarily unavailable
File Size ReportThis report lists the sizes of files.
       size:     reqs: %bytes:
-----------: --------: ------:
          0:    54853:       :
   1B-  10B:      228:       :
  11B- 100B:    23751:       :
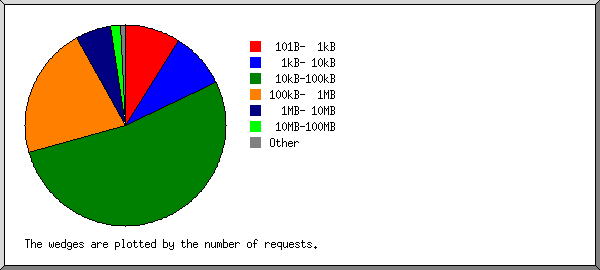
 101B-  1kB:  2008383:       :
  1kB- 10kB:  2019236:  0.02%:
 10kB-100kB: 11701002:  1.58%:
100kB-  1MB:  4757300:  2.57%:
  1MB- 10MB:  1285220:  7.50%:
 10MB-100MB:   332396: 18.57%:
100MB-  1GB:    93661: 53.17%:
      > 1GB:     3795: 16.59%:
File Type ReportThis report lists the extensions of files.
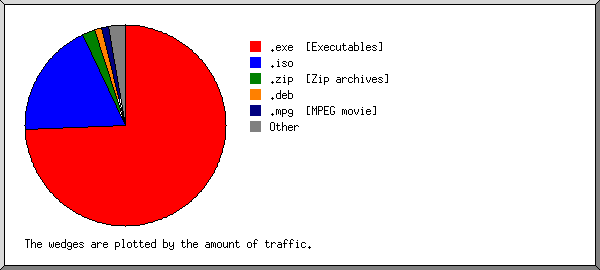
Listing extensions with at least 0.1% of the traffic, sorted by the amount of traffic. reqs: %bytes: extension --------: ------: --------- 13058075: 74.30%: .exe [Executables] 1462768: 18.76%: .iso 701842: 2.03%: .zip [Zip archives] 583540: 1.14%: .deb 79787: 1.08%: .mpg [MPEG movie] 1192651: 0.85%: .gz [Gzip compressed files] 901267: 0.78%: .tar.gz [Compressed archives] 191045: 0.48%: .rpm 28829: 0.39%: .dmg 126771: 0.27%: .wmv 205115: 0.15%: .bz2 176424: 0.12%: .mp3 [MP3 sound files] 4472978: 0.43%: [not listed: 4,762 extensions] Directory ReportThis report lists the directories from which files were requested. (The figures for each directory include all of its subdirectories.)
Listing directories with at least 0.01% of the traffic, sorted by the amount of traffic. reqs: %bytes: directory
--------: ------: ---------
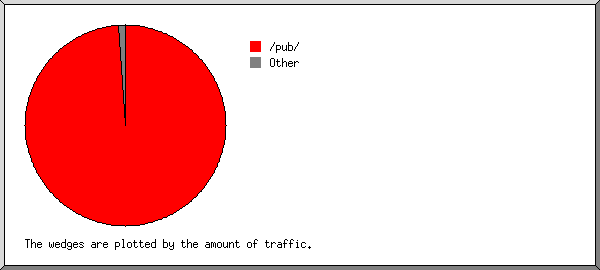
20757303: 99.02%: /pub/
19613: 0.57%: /files/
94043: 0.15%: http://
2271: 0.04%: /files1/
16291: 0.04%: /mods/
1026: 0.04%: /files7/
1410: 0.03%: /files5/
11134: 0.02%: /pix/
2065: 0.02%: /files3/
1054: 0.01%: /files4/
1373615: 0.07%: [not listed: 122 directories]
This analysis was produced by analog 6.0. Running time: 5 minutes, 28 seconds. (Go To: Top: General Summary: Monthly Report: Daily Summary: Hourly Summary: Organisation Report: Status Code Report: File Size Report: File Type Report: Directory Report) |
 ) represents 80,000 requests for pages or part thereof.


