Program started at Sat-14-Apr-2007 13:10. Analysed requests from Thu-01-Mar-2007 00:00 to Thu-29-Mar-2007 00:00 (28.00 days). (Go To: Top: General Summary: Monthly Report: Daily Summary: Hourly Summary: Organisation Report: Status Code Report: File Size Report: File Type Report: Directory Report) General SummaryThis report contains overall statistics. (Figures in parentheses refer to the 7-day period ending 31-Mar-2007 23:59).
Monthly ReportThis report lists the activity in each month.
Each unit ( month: reqs: %reqs: pages: %pages: Tbytes: %bytes: --------: --------: ------: ------: ------: ------: ------: Mar 2007: 10129808: 100%: 849743: 100%: 13.80: 100%:Busiest month: Mar 2007 (849,743 requests for pages). Daily SummaryThis report lists the total activity for each day of the week, summed over all the weeks in the report.
Each unit ( day: reqs: %reqs: pages: %pages: Tbytes: %bytes: ---: -------: ------: ------: ------: ------: ------: Sun: 1308773: 12.92%: 110406: 12.99%: 1.88: 13.63%: Hourly SummaryThis report lists the total activity for each hour of the day, summed over all the days in the report.
Each unit ( hour: reqs: %reqs: pages: %pages: Gbytes: %bytes: ----: ------: ------: -----: ------: ------: ------: 0: 310660: 3.07%: 29906: 3.52%: 477.46: 3.38%: Organisation ReportThis report lists the organisations of the computers which requested files.
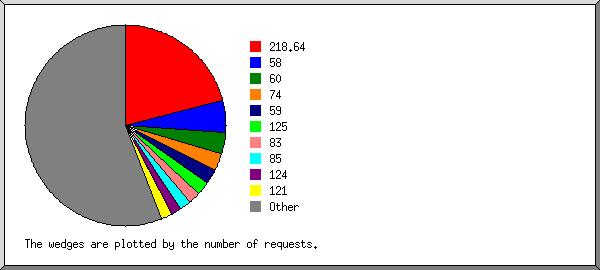
Listing the top 20 organisations by the number of requests, sorted by the number of requests. reqs: %bytes: organisation -------: ------: ------------ 2313485: 0.61%: 218.64 503043: 0.78%: 58 310221: 0.47%: 60 293926: 0.61%: 74 230736: 0.51%: 59 207888: 0.53%: 125 188272: 8.96%: 83 177210: 5.25%: 82 176806: 6.54%: 85 176522: 0.03%: 65.214 174165: 0.44%: 124 164718: 0.71%: 121 156965: 6.87%: 84 119650: : 200.17 104939: 3.87%: 87 100873: 0.02%: 65.55 99950: 2.79%: 88 92036: 2.48%: 89 66313: 0.03%: 66.249 64687: 0.02%: 196.203 4407403: 58.48%: [not listed: 9,895 organisations] Status Code ReportThis report lists the HTTP status codes of all requests.
Listing status codes, sorted numerically. reqs: status code
-------: -----------
4145223: 200 OK
5835166: 206 Partial content
8922: 301 Document moved permanently
13664: 302 Document found elsewhere
149419: 304 Not modified since last retrieval
15249: 400 Bad request
10294: 403 Access forbidden
8754031: 404 Document not found
9937: 405 Method not allowed
2: 406 Document not acceptable to client
3: 412 Precondition failed
24126: 416 Requested range not valid
32: 500 Internal server error
6: 501 Request type not supported
551426: 503 Service temporarily unavailable
File Size ReportThis report lists the sizes of files.
       size:    reqs: %bytes:
-----------: -------: ------:
          0:  148906:       :
   1B-  10B:      31:       :
  11B- 100B:   16384:       :
 101B-  1kB: 1039572:       :
  1kB- 10kB: 1477415:  0.04%:
 10kB-100kB: 5758859:  2.37%:
100kB-  1MB: 1274689:  2.28%:
  1MB- 10MB:  258047:  5.82%:
 10MB-100MB:  135095: 26.39%:
100MB-  1GB:   19575: 43.96%:
      > 1GB:    1235: 19.13%:
File Type ReportThis report lists the extensions of files.
Listing extensions with at least 0.1% of the traffic, sorted by the amount of traffic. reqs: %bytes: extension -------: ------: --------- 3702173: 60.50%: .exe [Executables] 1035122: 29.86%: .iso 537258: 2.58%: .zip [Zip archives] 483601: 2.42%: .deb 33682: 1.10%: .mpg [MPEG movie] 991469: 1.08%: .gz [Gzip compressed files] 695012: 0.94%: .tar.gz [Compressed archives] 213236: 0.66%: .rpm 20231: 0.46%: .dmg 304253: 0.18%: [no extension] 104366: 0.17%: .mp3 [MP3 sound files] 15819: 0.14%: .wmv 166264: 0.14%: .bz2 2139: 0.13%: .DU 2518529: 0.58%: [not listed: 7,271 extensions] Directory ReportThis report lists the directories from which files were requested. (The figures for each directory include all of its subdirectories.)
Listing directories with at least 0.01% of the traffic, sorted by the amount of traffic. reqs: %bytes: directory
-------: ------: ---------
9355806: 97.87%: /pub/
4427: 0.87%: /files1/
3667: 0.39%: /files7/
8058: 0.23%: /files/
3085: 0.22%: /files5/
8609: 0.11%: /dist/
3023: 0.08%: /files2/
1683: 0.05%: /files3/
1000: 0.04%: /game/
928: 0.02%: /files6/
976: 0.02%: /files4/
536: 0.02%: /misc/
30174: 0.01%: /delphi/
2492: 0.01%: /mods/
703678: 0.07%: [not listed: 116 directories]
This analysis was produced by analog 6.0. Running time: 4 minutes, 17 seconds. (Go To: Top: General Summary: Monthly Report: Daily Summary: Hourly Summary: Organisation Report: Status Code Report: File Size Report: File Type Report: Directory Report) |
 ) represents 60,000 requests for pages or part thereof.


