Analysed requests from Thu-01-Feb-2007 00:00 to Wed-28-Feb-2007 23:59 (28.00 days). (Go To: Top: General Summary: Yearly Report: Quarterly Report: Monthly Report: Weekly Report: Daily Report: Daily Summary: Hourly Summary: Domain Report: Organisation Report: Host Report: File Size Report: File Type Report: Directory Report) General SummaryThis report contains overall statistics. (Figures in parentheses refer to the 7-day period ending 28-Feb-2007 23:59).
Yearly ReportThis report lists the activity in each year.
Each unit ( year: reqs: %reqs: pages: %pages: Tbytes: %bytes: ----: -------: ------: -----: ------: ------: ------: 2007: 2943612: 100%: 40700: 100%: 14.82: 100%:Busiest year: 2007 (40,700 requests for pages). Quarterly ReportThis report lists the activity in each quarter.
Each unit ( quarter: reqs: %reqs: pages: %pages: Tbytes: %bytes: ------------: -------: ------: -----: ------: ------: ------: Jan-Mar 2007: 2943612: 100%: 40700: 100%: 14.82: 100%:Busiest quarter: Jan-Mar 2007 (40,700 requests for pages). Monthly ReportThis report lists the activity in each month.
Each unit ( month: reqs: %reqs: pages: %pages: Tbytes: %bytes: --------: -------: ------: -----: ------: ------: ------: Feb 2007: 2943612: 100%: 40700: 100%: 14.82: 100%:Busiest month: Feb 2007 (40,700 requests for pages). Weekly ReportThis report lists the activity in each week.
Each unit ( week beg.: reqs: %reqs: pages: %pages: Tbytes: %bytes: ---------: ------: ------: -----: ------: ------: ------: 28/Jan/07: 276790: 9.40%: 13909: 34.17%: 1.65: 11.16%:Busiest week: week beginning 28/Jan/07 (13,909 requests for pages). Daily ReportThis report lists the activity in each day.
Each unit ( date: reqs: %reqs: pages: %pages: Gbytes: %bytes: ---------: ------: ------: -----: ------: ------: ------: 1/Feb/07: 108460: 3.68%: 1395: 3.43%: 571.51: 3.77%:Busiest day: 2/Feb/07 (12,347 requests for pages). Daily SummaryThis report lists the total activity for each day of the week, summed over all the weeks in the report.
Each unit ( day: reqs: %reqs: pages: %pages: Tbytes: %bytes: ---: ------: ------: -----: ------: ------: ------: Sun: 455365: 15.47%: 9508: 23.36%: 2.33: 15.70%: Hourly SummaryThis report lists the total activity for each hour of the day, summed over all the days in the report.
Each unit ( hour: reqs: %reqs: pages: %pages: Gbytes: %bytes: ----: ------: ------: -----: ------: ------: ------: 0: 106661: 3.62%: 1317: 3.24%: 596.74: 3.93%: Domain ReportThis report lists the countries of the computers which requested files. Listing domains, sorted by the amount of traffic. reqs: %bytes: domain -------: ------: ------ 2943612: 100%: [unresolved numerical addresses] Organisation ReportThis report lists the organisations of the computers which requested files.
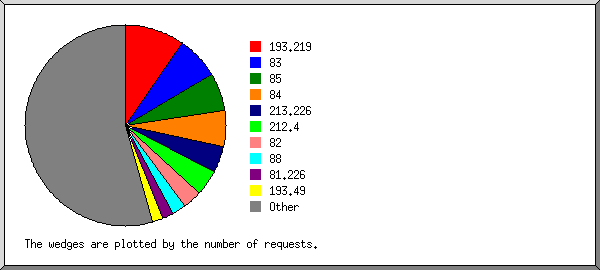
Listing the top 20 organisations by the number of requests, sorted by the number of requests. reqs: %bytes: organisation -------: ------: ------------ 285371: 2.58%: 193.219 204495: 8.85%: 83 176206: 5.62%: 85 172974: 12.93%: 84 125529: 1.59%: 213.226 121336: 8.02%: 212.4 85757: 3.24%: 82 67920: 1.59%: 88 52000: 0.44%: 81.226 47852: 0.59%: 193.49 40949: 1.94%: 87 39402: 0.37%: 193.10 34857: 0.53%: 81.236 34444: 0.30%: 81.170 30218: 1.88%: 89 27733: 0.71%: 213.114 26939: 0.73%: 86 25650: 0.63%: 213.112 22733: 0.01%: 193.40 22620: 0.06%: 194.85 1298627: 47.41%: [not listed: 7,351 organisations] Host ReportThis report lists the computers which requested files.
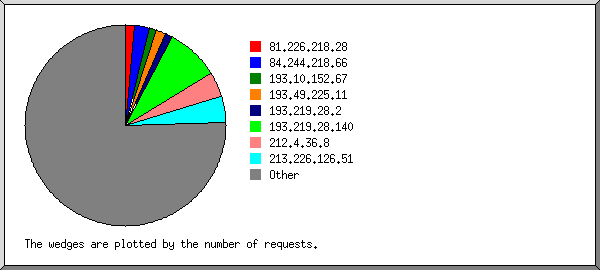
Listing the top 50 hosts by the number of requests, sorted alphabetically. reqs: %bytes: host -------: ------: ---- 11321: 0.06%: 20.137.7.64 6956: 0.05%: 62.108.217.105 10546: 0.05%: 62.209.67.58 8692: 0.02%: 75.132.142.113 14723: 0.05%: 80.223.19.231 8283: 0.32%: 81.166.57.206 29012: 0.15%: 81.170.255.102 45381: 0.25%: 81.226.218.28 6356: 0.04%: 81.229.98.79 5726: : 81.233.56.195 7235: 0.03%: 81.233.216.23 24496: 0.32%: 81.236.242.172 12273: : 82.27.249.243 5664: 0.05%: 83.226.9.71 13958: 0.07%: 83.249.49.162 5678: 0.04%: 83.254.93.77 7521: 0.02%: 83.254.93.166 6987: 0.11%: 84.190.112.35 5680: 0.03%: 84.202.170.72 69463: 0.10%: 84.244.218.66 13679: 0.05%: 85.165.219.243 13784: 0.22%: 85.195.14.159 22383: 0.08%: 85.197.141.231 26746: 0.02%: 88.146.177.20 9670: 0.02%: 89.149.202.113 5799: 0.03%: 129.13.108.115 7062: 0.21%: 130.240.22.195 5856: : 148.203.156.11 7871: 0.54%: 192.36.213.1 7719: : 192.102.44.227 33715: 0.21%: 193.10.152.67 21647: : 193.40.60.98 47785: 0.58%: 193.49.225.11 10869: 0.08%: 193.71.68.2 33731: 0.37%: 193.219.28.2 250376: 1.93%: 193.219.28.140 6125: 0.05%: 194.71.159.2 11046: : 194.85.185.72 9831: 0.04%: 194.85.229.252 6697: 0.05%: 203.16.234.17 121255: 8.02%: 212.4.36.8 6838: 0.03%: 212.209.194.26 5672: 0.01%: 213.66.17.156 5868: 0.03%: 213.113.29.119 6993: 0.05%: 213.114.10.57 9381: 0.05%: 213.190.51.90 21439: 0.16%: 213.204.210.59 121967: 1.44%: 213.226.126.51 6112: : 217.20.163.37 6170: 0.06%: 217.211.191.234 1773575: 83.89%: [not listed: 114,109 hosts] File Size ReportThis report lists the sizes of files.
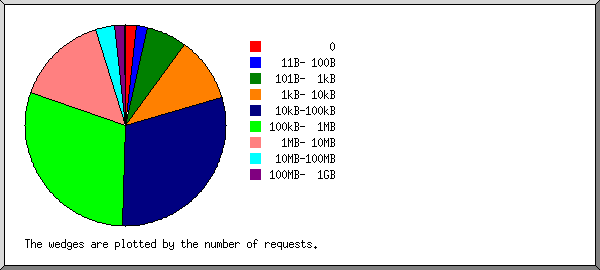
       size:   reqs: %bytes:
-----------: ------: ------:
          0:  56144:       :
   1B-  10B:    455:       :
  11B- 100B:  52494:       :
 101B-  1kB: 192568:       :
  1kB- 10kB: 303258:  0.01%:
 10kB-100kB: 881276:  0.23%:
100kB-  1MB: 877660:  1.94%:
  1MB- 10MB: 441725:  9.18%:
 10MB-100MB:  87435: 12.80%:
100MB-  1GB:  50516: 75.05%:
      > 1GB:     81:  0.78%:
File Type ReportThis report lists the extensions of files.
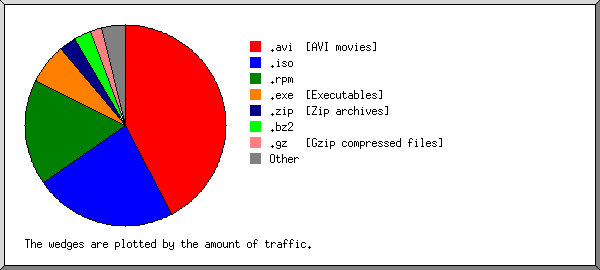
Listing extensions with at least 0.1% of the traffic, sorted by the amount of traffic. reqs: %bytes: extension -------: ------: --------- 57281: 42.36%: .avi [AVI movies] 8264: 22.94%: .iso 1144201: 17.07%: .rpm 40584: 6.47%: .exe [Executables] 134053: 2.83%: .zip [Zip archives] 471958: 2.68%: .bz2 118951: 1.83%: .gz [Gzip compressed files] 62719: 1.24%: .tar.gz [Compressed archives] 3036: 0.19%: .list.gz 106044: 0.83%: [no extension] 163311: 0.80%: .deb 16633: 0.69%: .cz 2330: 0.37%: .mpg [MPEG movie] 18687: 0.34%: .tgz 661315: 0.79%: [not listed: 2,417 extensions] Directory ReportThis report lists the directories from which files were requested. (The figures for each directory include all of its subdirectories.) Listing directories with at least 0.01% of the traffic, sorted by the amount of traffic. reqs: %bytes: directory -------: ------: --------- 2943612: 100%: /ftp.sunet.se/ This analysis was produced by analog 6.0. (Go To: Top: General Summary: Yearly Report: Quarterly Report: Monthly Report: Weekly Report: Daily Report: Daily Summary: Hourly Summary: Domain Report: Organisation Report: Host Report: File Size Report: File Type Report: Directory Report) |
 ) represents 3,000 requests for pages or part thereof.


