Program started at Tue-06-Feb-2007 08:57. Analysed requests from Mon-01-Jan-2007 00:00 to Wed-31-Jan-2007 23:59 (31.00 days). (Go To: Top: General Summary: Monthly Report: Daily Summary: Hourly Summary: Organisation Report: Status Code Report: File Size Report: File Type Report: Directory Report) General SummaryThis report contains overall statistics. (Figures in parentheses refer to the 7-day period ending 31-Jan-2007 23:59).
Monthly ReportThis report lists the activity in each month.
Each unit ( month: reqs: %reqs: pages: %pages: Tbytes: %bytes: --------: --------: ------: -------: ------: ------: ------: Jan 2007: 52391645: 100%: 1873388: 100%: 180.98: 100%:Busiest month: Jan 2007 (1,873,388 requests for pages). Daily SummaryThis report lists the total activity for each day of the week, summed over all the weeks in the report.
Each unit ( day: reqs: %reqs: pages: %pages: Tbytes: %bytes: ---: -------: ------: ------: ------: ------: ------: Sun: 6838126: 13.05%: 249082: 13.30%: 24.61: 13.60%: Hourly SummaryThis report lists the total activity for each hour of the day, summed over all the days in the report.
Each unit ( hour: reqs: %reqs: pages: %pages: Tbytes: %bytes: ----: -------: ------: -----: ------: ------: ------: 0: 1657214: 3.16%: 70916: 3.79%: 7.36: 4.06%: Organisation ReportThis report lists the organisations of the computers which requested files.
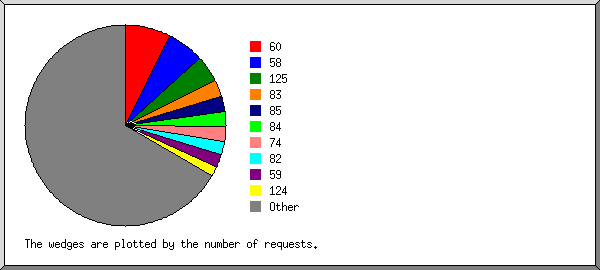
Listing the top 20 organisations by the number of requests, sorted by the number of requests. reqs: %bytes: organisation --------: ------: ------------ 3703660: 2.89%: 60 3210016: 2.13%: 58 2230659: 2.68%: 125 1441983: 4.41%: 83 1288638: 4.71%: 84 1279680: 3.68%: 85 1223313: 1.19%: 74 1068228: 2.52%: 82 1068154: 0.87%: 59 954114: 1.49%: 124 791273: 1.62%: 88 777955: 2.29%: 87 613036: 0.68%: 121 575857: 1.99%: 89 548905: 0.30%: 212.116 518806: 2.06%: 71 485696: 1.20%: 86 477789: 0.28%: 219.95 413576: 1.90%: 202.156 346521: 0.20%: 212.71 29373786: 60.92%: [not listed: 11,182 organisations] Status Code ReportThis report lists the HTTP status codes of all requests.
Listing status codes, sorted numerically. reqs: status code
--------: -----------
12988123: 200 OK
38799667: 206 Partial content
30490: 301 Document moved permanently
43619: 302 Document found elsewhere
603855: 304 Not modified since last retrieval
38278: 400 Bad request
203267: 403 Access forbidden
2399245: 404 Document not found
24525: 405 Method not allowed
15: 406 Document not acceptable to client
3: 412 Precondition failed
17: 414 Requested filename too long
860200: 416 Requested range not valid
48: 500 Internal server error
105: 501 Request type not supported
45212686: 503 Service temporarily unavailable
File Size ReportThis report lists the sizes of files.
       size:     reqs: %bytes:
-----------: --------: ------:
          0:   556644:       :
   1B-  10B:      143:       :
  11B- 100B:    32655:       :
 101B-  1kB:  3370076:       :
  1kB- 10kB:  5147910:  0.01%:
 10kB-100kB: 22230078:  0.75%:
100kB-  1MB: 13573909:  2.23%:
  1MB- 10MB:  4589431:  8.11%:
 10MB-100MB:  2320230: 31.51%:
100MB-  1GB:   569426: 55.87%:
      > 1GB:     1143:  1.52%:
File Type ReportThis report lists the extensions of files.
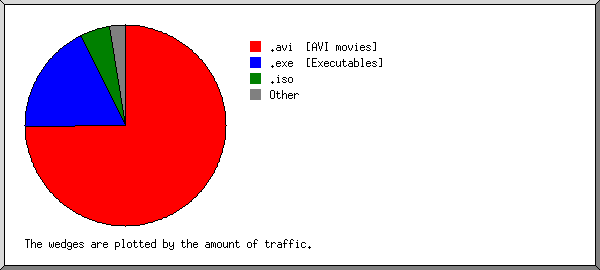
Listing extensions with at least 0.1% of the traffic, sorted by the amount of traffic. reqs: %bytes: extension --------: ------: --------- 26943737: 74.52%: .avi [AVI movies] 8456298: 17.98%: .exe [Executables] 5271827: 4.95%: .iso 907812: 0.67%: .zip [Zip archives] 830614: 0.57%: .deb 569159: 0.39%: .rpm 608313: 0.26%: .gz [Gzip compressed files] 448059: 0.23%: .tar.gz [Compressed archives] 69571: 0.23%: .mpg [MPEG movie] 8734314: 0.44%: [not listed: 7,362 extensions] Directory ReportThis report lists the directories from which files were requested. (The figures for each directory include all of its subdirectories.)
Listing directories with at least 0.01% of the traffic, sorted by the amount of traffic. reqs: %bytes: directory
--------: ------: ---------
49926718: 92.50%: /pub/
113719: 5.02%: /files/
50050: 0.98%: /files1/
45014: 0.87%: /files5/
35018: 0.18%: /files2/
37052: 0.16%: /files3/
23454: 0.15%: /files7/
11663: 0.03%: /files4/
35652: 0.03%: /dist/
8505: 0.02%: /files6/
2104800: 0.04%: [not listed: 123 directories]
This analysis was produced by analog 6.0. Running time: 21 minutes, 6 seconds. (Go To: Top: General Summary: Monthly Report: Daily Summary: Hourly Summary: Organisation Report: Status Code Report: File Size Report: File Type Report: Directory Report) |
 ) represents 150,000 requests for pages or part thereof.


 Mon: 8659703: 16.53%: 300307: 16.03%: 30.16: 16.67%:


