Program started at Mon-02-Oct-2006 21:25. Analysed requests from Fri-01-Sep-2006 00:00 to Sat-30-Sep-2006 23:59 (30.00 days). (Go To: Top: General Summary: Monthly Report: Daily Summary: Hourly Summary: Organisation Report: Status Code Report: File Size Report: File Type Report: Directory Report) General SummaryThis report contains overall statistics. (Figures in parentheses refer to the 7-day period ending 30-Sep-2006 23:59).
Monthly ReportThis report lists the activity in each month.
Each unit ( month: reqs: %reqs: pages: %pages: Tbytes: %bytes: --------: --------: ------: -------: ------: ------: ------: Sep 2006: 17853689: 100%: 1542822: 100%: 78.91: 100%:Busiest month: Sep 2006 (1,542,822 requests for pages). Daily SummaryThis report lists the total activity for each day of the week, summed over all the weeks in the report.
Each unit ( day: reqs: %reqs: pages: %pages: Tbytes: %bytes: ---: -------: ------: ------: ------: ------: ------: Sun: 2597096: 14.55%: 201200: 13.04%: 11.14: 14.11%: Hourly SummaryThis report lists the total activity for each hour of the day, summed over all the days in the report.
Each unit ( hour: reqs: %reqs: pages: %pages: Tbytes: %bytes: ----: ------: ------: -----: ------: ------: ------: 0: 670443: 3.76%: 57939: 3.76%: 2.78: 3.52%: Organisation ReportThis report lists the organisations of the computers which requested files.
Listing the top 20 organisations by the number of requests, sorted by the number of requests. reqs: %bytes: organisation -------: ------: ------------ 1520846: 1.23%: 72 1229883: 0.22%: 61.208 698200: 5.69%: 83 680739: 0.09%: 81.210 625218: 1.89%: 60 526850: 0.04%: 65.214 478723: 3.30%: 82 425824: 1.80%: 58 412419: 5.32%: 84 382726: 3.00%: 85 312234: 1.63%: 125 185217: 1.77%: 87 174972: 0.19%: 219.95 169887: 1.81%: 69 159036: 2.15%: 71 155277: 1.30%: 89 147773: 0.03%: 200.17 130457: 0.02%: 196.35 128166: 1.39%: 88 122381: 1.66%: 70 9186861: 65.48%: [not listed: 11,758 organisations] Status Code ReportThis report lists the HTTP status codes of all requests.
Listing status codes, sorted numerically. reqs: status code
--------: -----------
7030272: 200 OK
9738262: 206 Partial content
36703: 301 Document moved permanently
64176: 302 Document found elsewhere
1085155: 304 Not modified since last retrieval
16262: 400 Bad request
5224: 403 Access forbidden
1312532: 404 Document not found
17721: 405 Method not allowed
34: 406 Document not acceptable to client
1: 412 Precondition failed
1: 414 Requested filename too long
112793: 416 Requested range not valid
46: 500 Internal server error
400: 501 Request type not supported
24337504: 503 Service temporarily unavailable
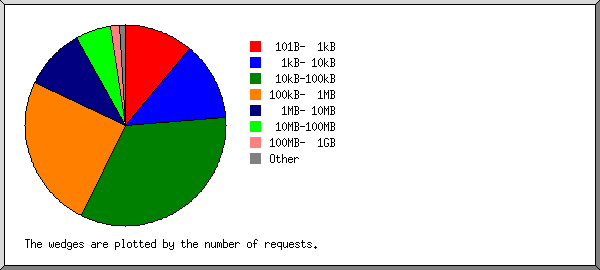
File Size ReportThis report lists the sizes of files.
       size:    reqs: %bytes:
-----------: -------: ------:
          0:  145034:       :
   1B-  10B:     121:       :
  11B- 100B:   17251:       :
 101B-  1kB: 2008955:       :
  1kB- 10kB: 2248957:  0.01%:
 10kB-100kB: 5932290:  0.43%:
100kB-  1MB: 4444651:  1.71%:
  1MB- 10MB: 1772919:  7.32%:
 10MB-100MB: 1026674: 32.54%:
100MB-  1GB:  256663: 57.44%:
      > 1GB:     174:  0.54%:
File Type ReportThis report lists the extensions of files.
Listing extensions with at least 0.1% of the traffic, sorted by the amount of traffic. reqs: %bytes: extension -------: ------: --------- 9062976: 83.45%: .avi [AVI movies] 1367383: 10.95%: .exe [Executables] 173393: 2.84%: .iso 299313: 0.92%: .zip [Zip archives] 330476: 0.51%: .rpm 26221: 0.36%: .mpg [MPEG movie] 373702: 0.25%: .deb 128752: 0.16%: .gz [Gzip compressed files] 44923: 0.12%: .tar.gz [Compressed archives] 6975: 0.15%: .dmg 6084498: 0.41%: [not listed: 7,712 extensions] Directory ReportThis report lists the directories from which files were requested. (The figures for each directory include all of its subdirectories.)
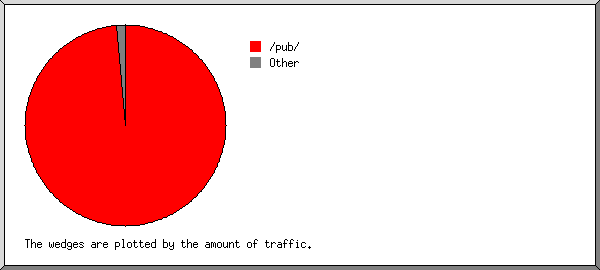
Listing directories with at least 0.01% of the traffic, sorted by the amount of traffic. reqs: %bytes: directory
--------: ------: ---------
16260424: 98.66%: /pub/
23875: 0.93%: /files/
6808: 0.11%: /files5/
8804: 0.08%: /files3/
5428: 0.06%: /files4/
29971: 0.05%: /dist/
50746: 0.03%: http://
3947: 0.02%: /files1/
2617: 0.02%: /files7/
5192: 0.01%: /files2/
1455877: 0.03%: [not listed: 110 directories]
This analysis was produced by analog 6.0. Running time: 9 minutes, 19 seconds. (Go To: Top: General Summary: Monthly Report: Daily Summary: Hourly Summary: Organisation Report: Status Code Report: File Size Report: File Type Report: Directory Report) |
 ) represents 150,000 requests for pages or part thereof.


 Wed: 1941204: 10.87%: 187050: 12.12%: 9.30: 11.78%:


