Program started at Wed-01-Feb-2006 18:16. Analysed requests from Sun-01-Jan-2006 00:00 to Tue-31-Jan-2006 00:00 (30.00 days). (Go To: Top: General Summary: Monthly Report: Daily Summary: Hourly Summary: Organisation Report: Status Code Report: File Size Report: File Type Report: Directory Report) General SummaryThis report contains overall statistics. (Figures in parentheses refer to the 7-day period ending 31-Jan-2006 23:59).
Monthly ReportThis report lists the activity in each month.
Each unit ( month: reqs: %reqs: pages: %pages: Tbytes: %bytes: --------: --------: ------: -------: ------: ------: ------: Jan 2006: 16822771: 100%: 2173521: 100%: 68.28: 100%:Busiest month: Jan 2006 (2,173,521 requests for pages). Daily SummaryThis report lists the total activity for each day of the week, summed over all the weeks in the report.
Each unit ( day: reqs: %reqs: pages: %pages: Tbytes: %bytes: ---: -------: ------: ------: ------: ------: ------: Sun: 2659420: 15.81%: 361331: 16.62%: 10.67: 15.63%: Hourly SummaryThis report lists the total activity for each hour of the day, summed over all the days in the report.
Each unit ( hour: reqs: %reqs: pages: %pages: Tbytes: %bytes: ----: ------: ------: ------: ------: ------: ------: 0: 655348: 3.90%: 75485: 3.47%: 2.90: 4.25%: Organisation ReportThis report lists the organisations of the computers which requested files.
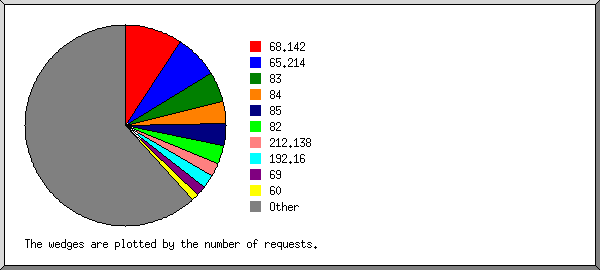
Listing the top 20 organisations by the number of requests, sorted by the number of requests. reqs: %bytes: organisation -------: ------: ------------ 1594529: 0.06%: 68.142 1180174: 0.16%: 65.214 803584: 5.34%: 83 618763: 7.42%: 84 599747: 3.81%: 85 513725: 4.42%: 82 394967: 1.07%: 212.138 349178: 0.01%: 192.16 289301: 2.75%: 69 189502: 0.97%: 60 138024: 0.10%: 222.124 137319: 0.14%: 61.247 123868: 2.63%: 70 109162: 0.12%: 218.208 108214: 1.45%: 86 107739: 1.32%: 87 106869: : 207.46 102811: 0.70%: 58 101848: 2.16%: 71 95488: 0.07%: 64.12 9157959: 65.30%: [not listed: 11,340 organisations] Status Code ReportThis report lists the HTTP status codes of all requests.
Listing status codes, sorted numerically. reqs: status code
--------: -----------
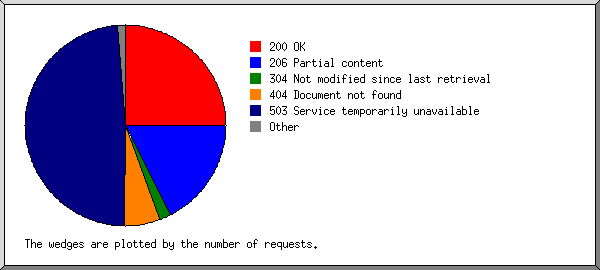
9288777: 200 OK
6849825: 206 Partial content
368645: 301 Document moved permanently
883: 302 Document found elsewhere
684169: 304 Not modified since last retrieval
10240: 400 Bad request
44645: 403 Access forbidden
2168225: 404 Document not found
15432: 405 Method not allowed
23: 406 Document not acceptable to client
43168: 416 Requested range not valid
177: 500 Internal server error
153: 501 Request type not supported
18172923: 503 Service temporarily unavailable
File Size ReportThis report lists the sizes of files.
       size:    reqs: %bytes:
-----------: -------: ------:
          0:    5386:       :
   1B-  10B:       0:       :
  11B- 100B:       1:       :
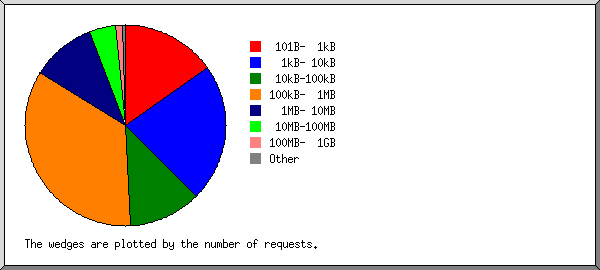
 101B-  1kB: 2587574:       :
  1kB- 10kB: 3526632:  0.02%:
 10kB-100kB: 1935481:  0.09%:
100kB-  1MB: 6040563:  3.15%:
  1MB- 10MB: 1800884:  7.57%:
 10MB-100MB:  712740: 28.47%:
100MB-  1GB:  213441: 60.58%:
      > 1GB:      69:  0.13%:
File Type ReportThis report lists the extensions of files.
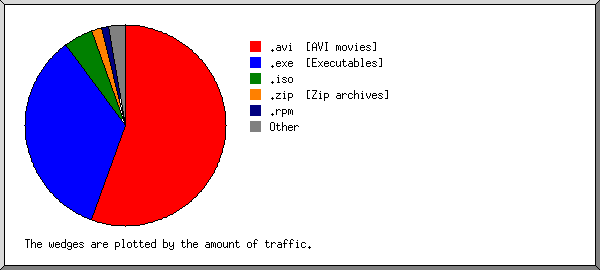
Listing extensions with at least 0.1% of the traffic, sorted by the amount of traffic. reqs: %bytes: extension -------: ------: --------- 4854693: 55.32%: .avi [AVI movies] 2535629: 34.76%: .exe [Executables] 47591: 4.62%: .iso 639351: 1.62%: .zip [Zip archives] 494863: 1.16%: .rpm 148439: 0.59%: .mpg [MPEG movie] 176659: 0.37%: .mp3 [MP3 sound files] 367397: 0.28%: .deb 130812: 0.26%: .gz [Gzip compressed files] 58787: 0.21%: .tar.gz [Compressed archives] 5267: 0.16%: .dmg 36476: 0.16%: .wmv 294921: 0.11%: .tbz 7090673: 0.61%: [not listed: 7,402 extensions] Directory ReportThis report lists the directories from which files were requested. (The figures for each directory include all of its subdirectories.)
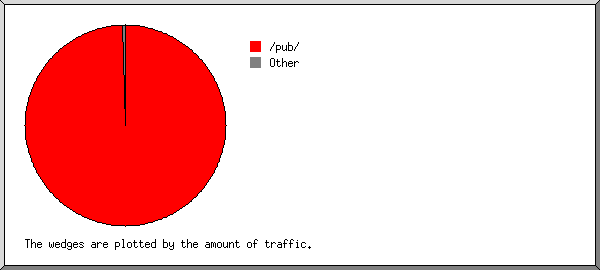
Listing directories with at least 0.01% of the traffic, sorted by the amount of traffic. reqs: %bytes: directory
--------: ------: ---------
14463449: 99.91%: /pub/
273559: 0.03%: /aminet/
1878: 0.02%: http://
238327: 0.02%: /~aminet/
1845558: 0.02%: [not listed: 32 directories]
This analysis was produced by analog 6.0. Running time: 6 minutes, 55 seconds. (Go To: Top: General Summary: Monthly Report: Daily Summary: Hourly Summary: Organisation Report: Status Code Report: File Size Report: File Type Report: Directory Report) |
 ) represents 150,000 requests for pages or part thereof.


