Program started at Wed-01-Feb-2006 19:06. Analysed requests from Sun-01-Jan-2006 00:00 to Tue-31-Jan-2006 23:59 (31.00 days). (Go To: Top: General Summary: Monthly Report: Daily Summary: Hourly Summary: Organisation Report: Status Code Report: File Size Report: File Type Report: Directory Report) General SummaryThis report contains overall statistics. (Figures in parentheses refer to the 7-day period ending 31-Jan-2006 23:59).
Monthly ReportThis report lists the activity in each month.
Each unit ( month: reqs: %reqs: pages: %pages: Tbytes: %bytes: --------: --------: ------: -------: ------: ------: ------: Jan 2006: 17874542: 100%: 2539528: 100%: 70.45: 100%:Busiest month: Jan 2006 (2,539,528 requests for pages). Daily SummaryThis report lists the total activity for each day of the week, summed over all the weeks in the report.
Each unit ( day: reqs: %reqs: pages: %pages: Tbytes: %bytes: ---: -------: ------: ------: ------: ------: ------: Sun: 2752016: 15.40%: 411959: 16.22%: 10.71: 15.20%: Hourly SummaryThis report lists the total activity for each hour of the day, summed over all the days in the report.
Each unit ( hour: reqs: %reqs: pages: %pages: Tbytes: %bytes: ----: ------: ------: ------: ------: ------: ------: 0: 692742: 3.88%: 88974: 3.50%: 2.99: 4.24%: Organisation ReportThis report lists the organisations of the computers which requested files.
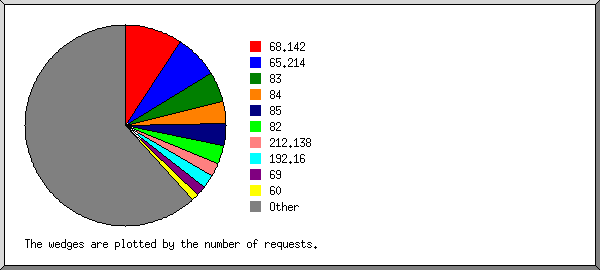
Listing the top 20 organisations by the number of requests, sorted by the number of requests. reqs: %bytes: organisation -------: ------: ------------ 1661201: 0.06%: 68.142 1269950: 0.16%: 65.214 850181: 5.38%: 83 645834: 7.35%: 84 627245: 3.81%: 85 537176: 4.39%: 82 398273: 1.07%: 212.138 361118: 0.01%: 192.16 295929: 2.74%: 69 192449: 0.96%: 60 182923: : 207.46 168866: 0.02%: 66.249 139042: 0.14%: 61.247 138397: 0.10%: 222.124 127560: 2.62%: 70 116832: 1.44%: 86 113670: 1.32%: 87 109522: 0.11%: 218.208 106441: 2.14%: 71 104929: 0.70%: 58 9727004: 65.47%: [not listed: 11,417 organisations] Status Code ReportThis report lists the HTTP status codes of all requests.
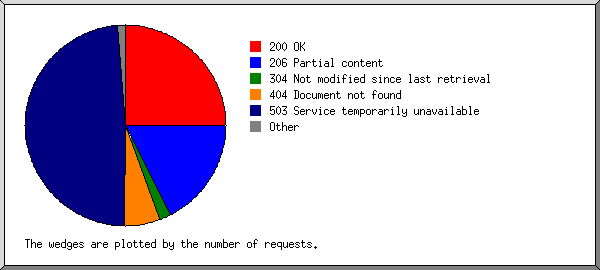
Listing status codes, sorted numerically. reqs: status code
--------: -----------
10111630: 200 OK
7031985: 206 Partial content
394107: 301 Document moved permanently
923: 302 Document found elsewhere
730927: 304 Not modified since last retrieval
10257: 400 Bad request
46428: 403 Access forbidden
2332520: 404 Document not found
15746: 405 Method not allowed
23: 406 Document not acceptable to client
44533: 416 Requested range not valid
179: 500 Internal server error
365: 501 Request type not supported
19596012: 503 Service temporarily unavailable
File Size ReportThis report lists the sizes of files.
       size:    reqs: %bytes:
-----------: -------: ------:
          0:   32672:       :
   1B-  10B:      97:       :
  11B- 100B:   28665:       :
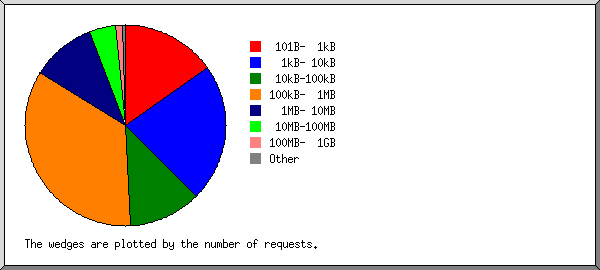
 101B-  1kB: 2738417:       :
  1kB- 10kB: 3959102:  0.02%:
 10kB-100kB: 2072152:  0.09%:
100kB-  1MB: 6193554:  3.13%:
  1MB- 10MB: 1890605:  7.71%:
 10MB-100MB:  739412: 28.57%:
100MB-  1GB:  219797: 60.34%:
      > 1GB:      69:  0.13%:
File Type ReportThis report lists the extensions of files.
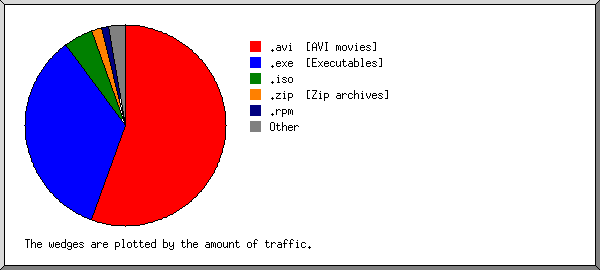
Listing extensions with at least 0.1% of the traffic, sorted by the amount of traffic. reqs: %bytes: extension -------: ------: --------- 4978040: 55.36%: .avi [AVI movies] 2627518: 34.56%: .exe [Executables] 49383: 4.64%: .iso 666808: 1.68%: .zip [Zip archives] 512571: 1.16%: .rpm 150599: 0.60%: .mpg [MPEG movie] 179976: 0.36%: .mp3 [MP3 sound files] 135757: 0.28%: .gz [Gzip compressed files] 61622: 0.23%: .tar.gz [Compressed archives] 377525: 0.28%: .deb 5408: 0.16%: .dmg 37410: 0.16%: .wmv 54976: 0.12%: .bz2 300203: 0.10%: .tbz 7798368: 0.54%: [not listed: 7,543 extensions] Directory ReportThis report lists the directories from which files were requested. (The figures for each directory include all of its subdirectories.)
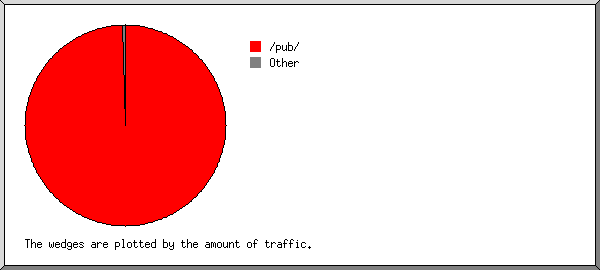
Listing directories with at least 0.01% of the traffic, sorted by the amount of traffic. reqs: %bytes: directory
--------: ------: ---------
14945470: 99.67%: /pub/
13278: 0.06%: /files3/
105638: 0.06%: /dist/
7171: 0.04%: /files4/
279569: 0.03%: /aminet/
9194: 0.03%: /files/
5989: 0.02%: /files2/
3902: 0.02%: http://
2417: 0.02%: /files6/
245439: 0.02%: /~aminet/
2107: 0.01%: /files5/
2254368: 0.03%: [not listed: 125 directories]
This analysis was produced by analog 6.0. Running time: 8 minutes, 32 seconds. (Go To: Top: General Summary: Monthly Report: Daily Summary: Hourly Summary: Organisation Report: Status Code Report: File Size Report: File Type Report: Directory Report) |
 ) represents 200,000 requests for pages or part thereof.


 Mon: 2854455: 15.97%: 369878: 14.56%: 9.97: 14.16%: